Grafana Dashboard for Jitsi-Meet
Introduction
To complement our Jitsi installation, we add a grafana dashboard to it so we can control usage, system load, traffic spikes etc.
For the sake of simplicity, we run our grafana, telegraf and influxdb instances in the same jail as jitsi-meet, so this post builds on top of the post explaining how to set up jitsi-meet.
Initial Set Up
We connect to the jail and install the packages:
$ iocage console jitsi
...
$ pkg install grafana6
...
$ pkg install influxdb
...
$ pkg install telegraf
Starting Services
To make sure everything is started automatically, add the services to /etc/rc.conf:
...
grafana_enable="YES"
influxd_enable="YES"
telegraf_enable="YES"
...
Then start all services manually for the first time:
$ /usr/local/etc/rc.d grafana start
...
$ /usr/local/etc/rc.d/influxd start
...
$ /usr/local/etc/rc.d/telegraf start
Setting up influxdb
Start the influxdb console:
$ influx
There create the user and database:
CREATE USER admin WITH PASSWORD 'MYPASSWORD' WITH ALL PRIVILEGES
CREATE DATABASE telegraf
Setting up jitsi-videobridge
If you have not yet done this, configure jitsi-videobridge to collect data. Also make sure that it is started correctly with jisti_videobridge_flags="--apis=rest,xmpp" in /etc/rc.conf so the necessary APIs are provided.
# The videobridge uses 443 by default with 4443 as a fallback, but since we're already
# running nginx on 443 in this example doc, we specify 4443 manually to avoid a race condition
org.jitsi.videobridge.TCP_HARVESTER_PORT=4443
org.ice4j.ice.harvest.NAT_HARVESTER_LOCAL_ADDRESS=10.10.0.1
org.ice4j.ice.harvest.NAT_HARVESTER_PUBLIC_ADDRESS=197.155.21.68
# 197.155.21.68 is the address assigned to jitsi.honeyguide.net

#
# For Grafana dashboard
#

# the callstats credentials
io.callstats.sdk.CallStats.appId="hgstats"
io.callstats.sdk.CallStats.keyId="GRAFANAKEY"
##io.callstats.sdk.CallStats.keyPath=
##io.callstats.sdk.CallStats.appSecret=

# the id of the videobridge
#io.callstats.sdk.CallStats.bridgeId=jitsi-videobridge.jitsi.honeyguide.net
#io.callstats.sdk.CallStats.conferenceIDPrefix=conference.jitsi.honeyguide.net

# enable statistics and callstats statistics and the report interval
org.jitsi.videobridge.ENABLE_STATISTICS=true
org.jitsi.videobridge.STATISTICS_INTERVAL.callstats.io=30000
org.jitsi.videobridge.STATISTICS_TRANSPORT=callstats.io
Setting up telegraf
Add the data source created above to /usr/local/etc/telegraf.conf:
...
[[inputs.http]]
  name_override = "jitsi_stats"
  urls = [
    "http://localhost:8080/colibri/stats"
  ]

  data_format = "json"
...
Setting up grafana
Initial Connect and Data Source Creation
Connect to your grafana instance the first time (it is listening at http://10.10.0.1:3000/ if your jail has 10.10.0.1 as IP address) with user admin and empty password and set the initial password.
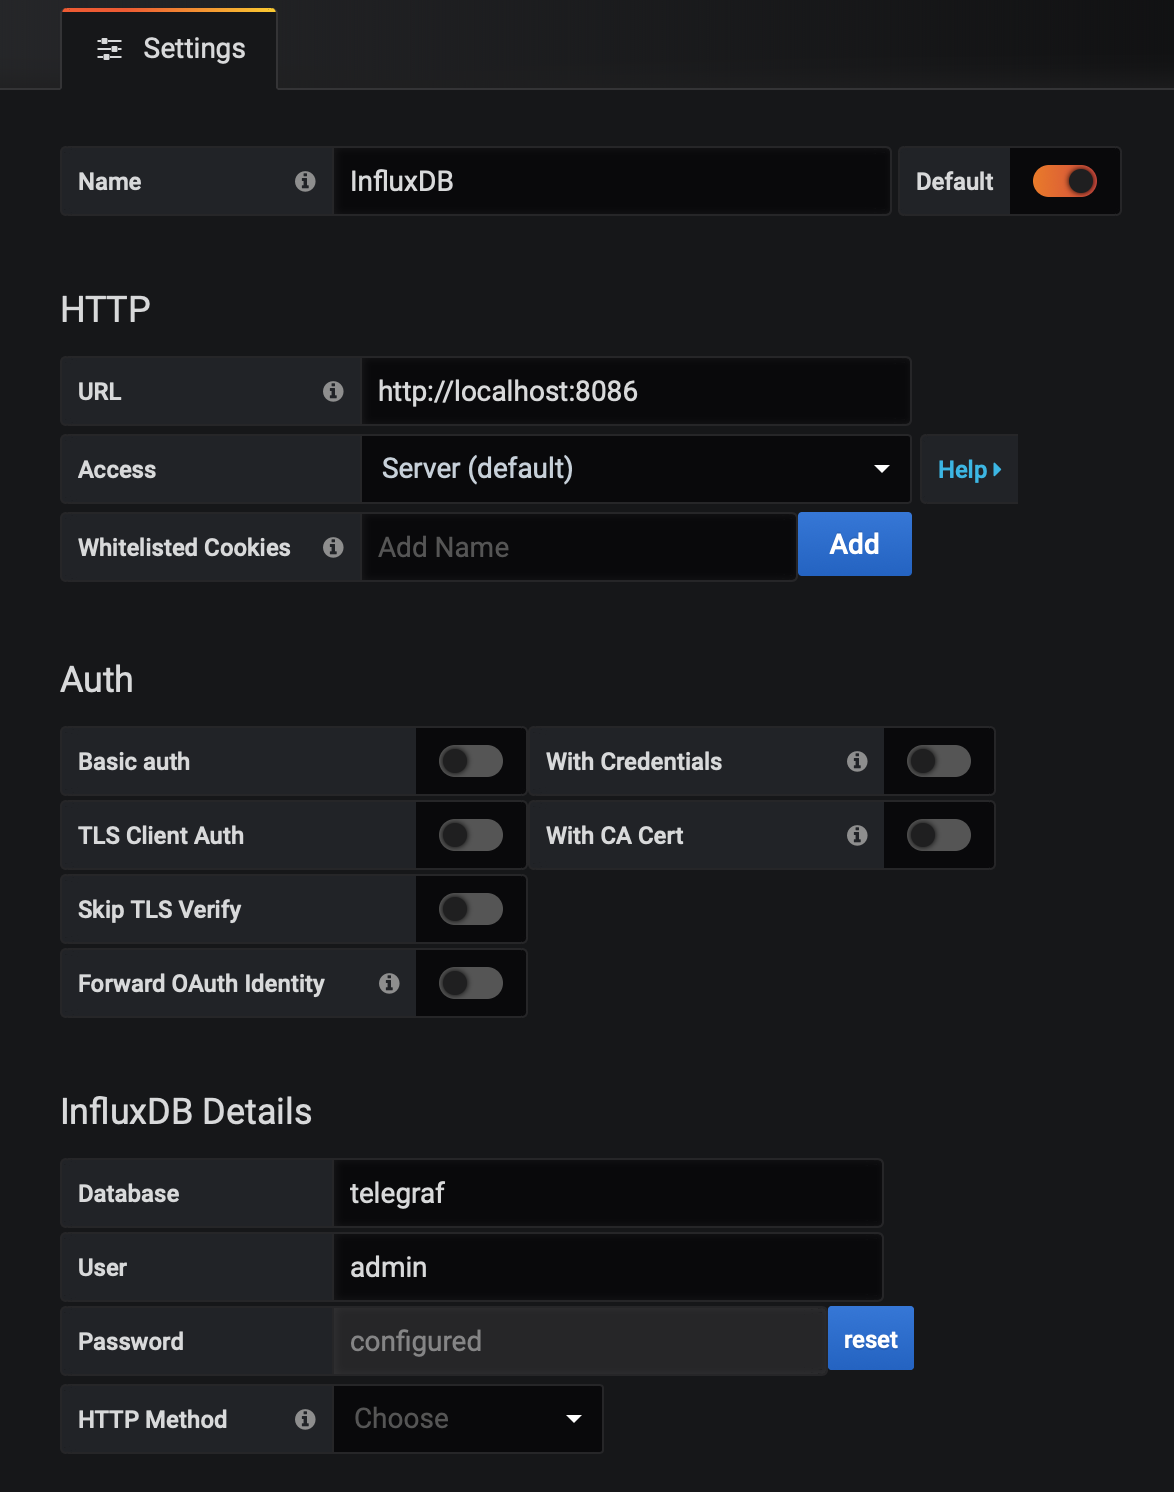
After that, click on the configuration “gear” icon and choose “Data Sources”. Click “Add Data Source” and select “Influx DB”. Use the following settings (and of course enter the password you have used when creating the database as described above):
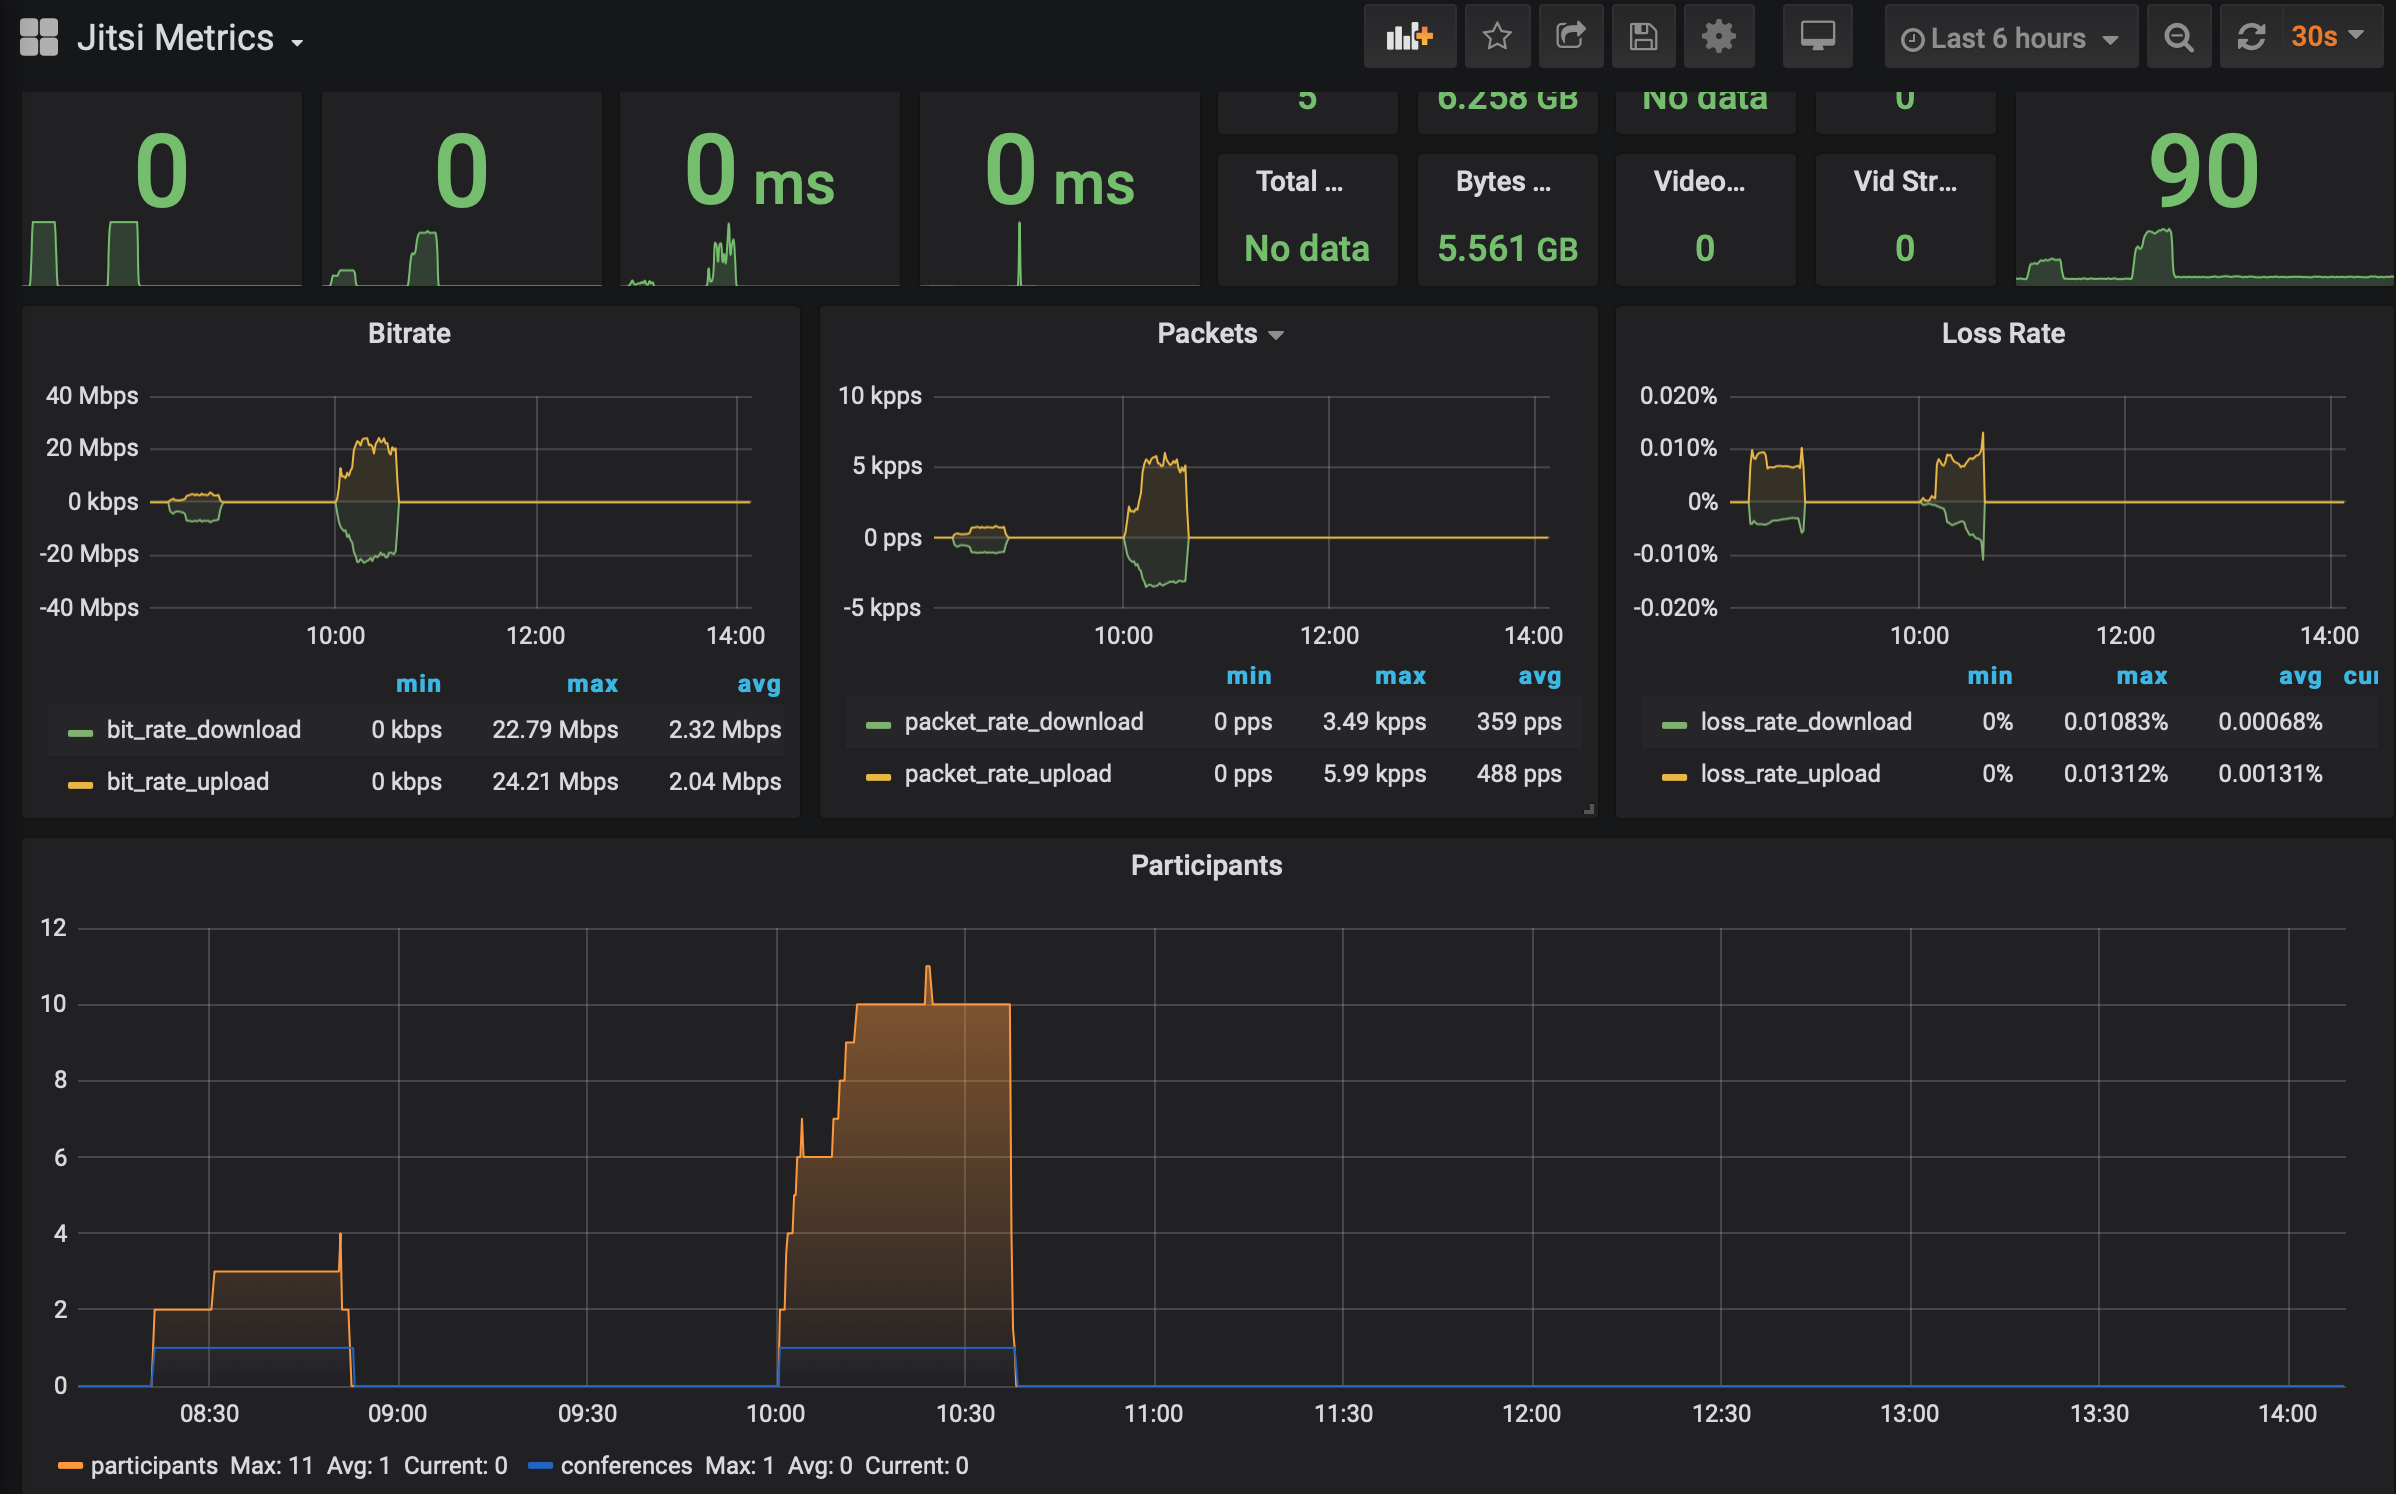
Import of Jitsi Dashboard
Then click on “+” in the left menu and choose “Import” from the menu.
You will find the dashboard to import at https://grafana.com/grafana/dashboards/11969/reviews. There you will see that the preconfigured dashboard has the number 11969, so you can simply enter this number in the ID field and click on “Import”, after that select the newly created InfluxDB as data source from the drop down and create the dashboard.
That’s it!